Top Concrete Cement Manufacturers Worldwide?
The global concrete cement market supports roads, bridges, housing, ports, and industrial facilities. Yet identifying the “top” manufacturers requires more than comparing annual production. Capacity matters, but so do product consistency, low-carbon technology, quality control, distribution strength, and verified environmental performance. Cement is the binding ingredient, while concrete also includes aggregates, water, and chemical admixtures. This distinction is important when evaluating companies using the phrase concrete cement.
Karen Scrivener, a leading cement scientist, has observed, “The construction industry is the largest consumer of raw materials in the world.” Her statement highlights the responsibility carried by major manufacturers. Leading producers increasingly invest in alternative fuels, supplementary cementitious materials, clinker reduction, and carbon-capture research. Their laboratories test strength, setting time, durability, and performance under demanding site conditions. A reliable bag or bulk shipment must perform consistently, from a city tower to a remote highway project.
This guide examines major manufacturers worldwide through practical and transparent criteria. These include geographic reach, production scale, technical innovation, sustainability reporting, and customer reliability. Rankings can shift.
Data is never perfect.
Some companies disclose detailed figures, while others publish limited regional information. Currency changes, acquisitions, plant closures, and local demand can also affect comparisons. Therefore, this overview should not be treated as an absolute verdict. It is a structured starting point for buyers, engineers, contractors, and investors seeking dependable concrete cement suppliers. Real project requirements still matter most.
Global Cement Scale: 4.1 Billion Metric Tons of Output in 2023
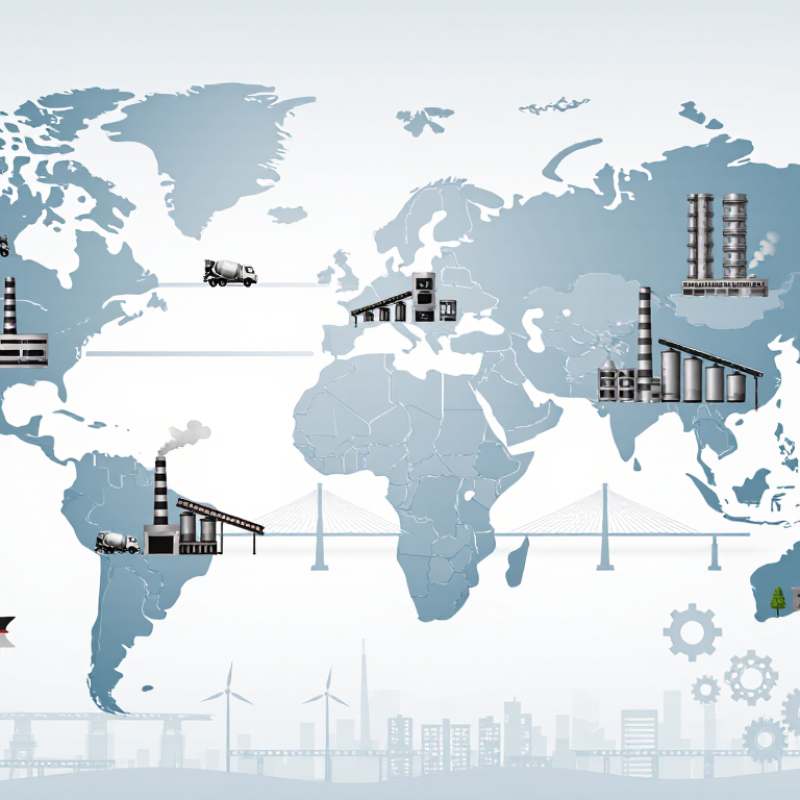
The global cement industry produced about 4.1 billion metric tons in 2023, according to the U.S. Geological Survey’s Mineral Commodity Summaries 2024. That scale makes cement one of the world’s most important industrial materials. China contributed roughly half of global output, while India ranked far behind but continued expanding capacity. Other major producing regions included Southeast Asia, the Middle East, Europe, and North America. These figures describe cement production, not finished concrete, which also depends on aggregates, water, and transport.
Production volume alone does not identify the strongest manufacturer. Reliable evaluation should include kiln efficiency, clinker ratio, alternative fuels, product consistency, and delivery reach. The International Energy Agency reports that cement production creates significant direct and indirect carbon emissions, especially through clinker manufacturing. Lower-carbon cement blends can reduce emissions, but performance depends on local standards and raw materials. In practice, a plant may report impressive capacity yet face delays, maintenance issues, or uneven quality. That deserves scrutiny.
Tips: Compare audited production data with installed capacity. Check product certifications, testing frequency, and environmental disclosures. Ask whether reported output reflects cement sales or only clinker production. The Global Cement and Concrete Association also stresses lifecycle measurement, not factory output alone. A smaller regional supplier may sometimes offer fresher deliveries and better technical support. That is easy to overlook.
Ranking Metrics: Capacity, Clinker Plants, Sales, and Geographic Reach
Top Concrete Cement Manufacturers Worldwide?
Ranking global cement manufacturers requires more than comparing annual sales. Capacity reveals industrial scale, while clinker plants show how much production is controlled directly. The Global Cement Directory 2024 lists more than 2,500 integrated cement plants worldwide, creating a practical database for plant ownership, kiln lines, and regional coverage. Capacity matters most when it is operational, not merely announced.
Production geography changes the ranking sharply. The U.S. Geological Survey estimated global cement output at about 4.1 billion metric tons in 2024, with China and India accounting for a substantial share. A producer with plants across Asia, Europe, Africa, and the Americas may carry stronger supply resilience than a larger, concentrated rival.
Geographic reach also reduces exposure to port delays, fuel shortages, and local construction cycles.
Small detail. It matters.
Sales add commercial evidence, but comparisons remain imperfect. Public filings often combine cement, aggregates, ready-mix concrete, and infrastructure services. The International Energy Agency reports that cement production remains highly energy-intensive, making fuel costs and clinker ratios important operating indicators.
A sound ranking should therefore score installed capacity, active clinker lines, cement sales volume, revenue quality, and country coverage. I would not treat any single table as definitive. Plant databases can lag closures, and reported capacity may include idle kilns.
That weakness deserves attention.
Holcim, Heidelberg Materials, and Cemex: Multinational Scale Compared
The world’s largest cement manufacturers compete through networks, not single plants. Three European-rooted groups stand out for multinational reach, with operations spanning Europe, North America, Latin America, Asia, and Africa. Their scale includes cement kilns, ready-mix facilities, aggregate quarries, terminals, and regional distribution fleets.
Scale differs in useful ways. One group is especially recognized for broad integrated production and international infrastructure. Another combines a deep European base with strong materials expertise and technical research. The third has a powerful presence across the Americas and selected global markets. For buyers, the practical comparison is not only annual output. Check local plant distance, clinker capacity, delivery reliability, product certifications, and technical support. A nearby terminal can matter more than a larger global footprint.
Tips: Compare delivered cost, not factory price. Request recent test data. Verify lead times during peak construction months. Ask how the supplier handles alternative fuels and lower-carbon cement blends. These details reveal operational maturity. Still, scale can mislead. A multinational may offer dependable systems, yet local management and transport conditions can change the experience. I would also examine maintenance records, quarry quality, and customer references before signing a long-term supply agreement. Big names help, but evidence matters more.
CNBM, UltraTech, and Votorantim: Regional Leaders and Capacity Data
Top Concrete Cement Manufacturers Worldwide?
Global cement leadership is concentrated in a few high-capacity regions. The Global Cement Directory 2024 estimates China’s installed cement capacity at more than 1.8 billion tonnes annually. India follows with roughly 550 million tonnes, while Brazil has close to 100 million tonnes. These figures describe national capacity, not actual production.
Public 2024 annual reports show a major Chinese producer controlling more than 500 million tonnes of annual cement capacity. India’s largest producer reports capacity above 150 million tonnes, supported by rapid infrastructure and housing demand. A leading Brazilian multinational operates approximately 50 million tonnes across the Americas, Europe, Africa, and Asia. Its regional spread reduces dependence on one construction market.
The comparison is not perfectly clean. Some reports include joint ventures, grinding plants, or planned expansions. Others count only consolidated assets. Installed capacity can also sit idle when energy prices rise or demand weakens. This matters in practical plant analysis. A modern kiln with strong logistics may outperform a larger but older network.
The International Energy Agency estimates cement production creates about 7% of global energy-related and process CO2 emissions. Efficiency now matters as much as scale. Lower-clinker cement, alternative fuels, and waste-heat recovery are becoming important capacity measures. Data changes quickly. Analysts should verify figures against audited reports and current plant directories.
Global Cement Production by Country, 2023
Estimated cement output in million metric tonnes. The chart highlights the largest national production bases supporting the global cement industry.
Source: U.S. Geological Survey, Mineral Commodity Summaries 2024. Values are estimates and rounded to the nearest million metric tonnes.
Industry Benchmark: Cement Produces About 7% of Global CO₂ Emissions
Top Concrete Cement Manufacturers Worldwide?
Cement production contributes about 7% of global carbon dioxide emissions. The figure varies by source and accounting method. Still, its climate impact is difficult to ignore. Cement is not concrete, but it is concrete’s essential binding ingredient.
The largest emissions often occur during clinker production. Limestone is heated in kilns, releasing carbon dioxide through calcination. Burning fuel adds more emissions. A single kiln can operate above 1,400°C, consuming large amounts of energy every hour. Dust, heat, and material quality create demanding conditions for plant operators.
Leading manufacturers are improving performance through lower-clinker cement, alternative fuels, renewable electricity, and carbon capture. Replacing part of the clinker with suitable mineral materials can reduce emissions without weakening construction performance. However, availability differs by region. Transport can also reduce the benefit. No single fix works everywhere.
Reliable comparisons should examine verified emissions, product strength, energy use, and reporting quality. Production volume alone does not prove environmental leadership. Some public claims sound more optimistic than the factory data supports. Independent audits matter. So do transparent boundaries, because counting only kiln emissions can hide impacts elsewhere. Concrete designers also have responsibility. Efficient structural design may reduce cement demand before manufacturing begins. The industry is moving, but not quickly enough.