How to Calculate Carbon Fiber Production Line Cost in 2026?
Calculating Carbon fiber production line cost in 2026 requires more than adding equipment prices. A complete estimate must examine the entire manufacturing route, from precursor preparation to carbonization, surface treatment, sizing, winding, testing, and factory utilities. Each stage leaves a financial footprint.
Dr. Richard Parnas, a recognized researcher in carbon-fiber manufacturing economics, has emphasized: “Carbon fiber economics depend on material yield, process energy, and production scale.” This principle remains practical. A furnace may appear affordable, yet its insulation quality, heating efficiency, maintenance schedule, and output stability can change the final investment significantly.
A serious estimate should separate capital expenditure from operating expenditure. Capital costs include oxidation ovens, carbonization furnaces, tension-control systems, exhaust treatment, laboratory equipment, installation, and commissioning. Operating costs include PAN precursor, electricity, natural gas, labor, cooling water, replacement parts, waste handling, and quality testing.
Do not ignore factory layout.
A narrow production hall may limit line expansion. Long delivery periods can also increase financing pressure before production begins. Imported components may involve currency changes, technical support delays, or additional integration work. These risks are easy to underestimate.
The most useful calculation combines three scenarios: conservative, expected, and aggressive. The expected case is not always the safest case. Actual costs can rise when yield is lower than planned or when the line runs below capacity. This guide examines the main cost drivers, explains practical estimation methods, and identifies overlooked expenses that can distort the Carbon fiber production line cost in 2026. Accurate planning starts with uncomfortable questions, not optimistic assumptions.
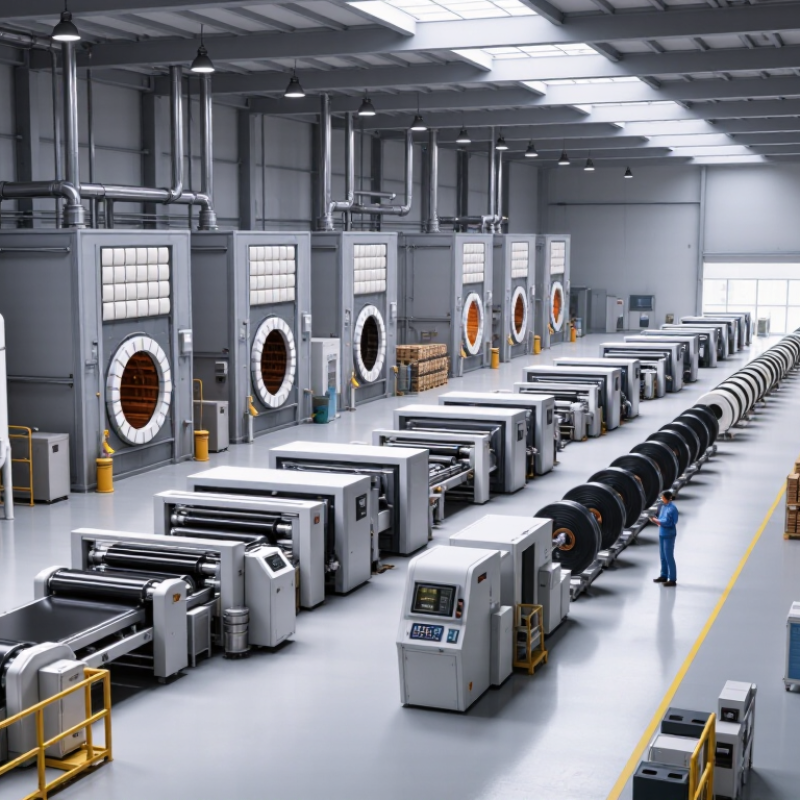
Defining the Scope and Capacity of a Carbon Fiber Production Line
Calculating carbon fiber production line cost starts with defining scope, not choosing equipment. Specify the product first: standard-modulus or intermediate-modulus fiber, 12K or 24K tow, and PAN or another precursor. Each choice changes furnace length, tension control, gas demand, and quality inspection. A 1,000-ton annual line is not simply ten times cheaper than ten 100-ton lines.
Capacity must include real operating conditions. State annual output, planned uptime, yield, maintenance hours, and ramp-up losses. A practical model may use 330 operating days and 85% availability. However, this assumption deserves review. New lines often lose capacity during stabilization and recipe changes. The U.S. Department of Energy’s Bandwidth Study on carbon fiber manufacturing reported energy use approaching 286 MJ per kilogram in some production routes. That figure shows why electricity, natural gas, nitrogen, and exhaust treatment require separate cost estimates.
Define the entire boundary. Include precursor storage, oxidation, carbonization, surface treatment, sizing, winding, testing, wastewater, and fire protection. Exclude buildings only when they are genuinely available. Otherwise, civil works can distort the budget. Industry capacity reports from the International Energy Agency and global wind-energy assessments also indicate strong demand for lightweight composite materials. Demand alone does not justify oversizing. A pilot line may need flexible equipment, while an aerospace-oriented line needs tighter traceability and redundant controls. I would also model 70% utilization for the first year. It may feel conservative, but optimistic capacity figures often hide the real production cost.
How to Calculate Carbon Fiber Production Line Cost in 2026?
Defining the scope and annual capacity is the first step in estimating a carbon fiber production line budget. The chart below shows an illustrative 2026 planning model for a PAN-based line from stabilization to winding, excluding land, buildings, precursor production, taxes, financing, and working capital.
Planning interpretation: A higher-capacity line generally reduces cost per annual tonne because major equipment, control systems, and utilities are shared across greater output. Actual investment depends on fiber grade, tow size, furnace configuration, automation level, energy prices, environmental systems, and local construction costs.
Calculating Production Capacity, Cost per Kilogram, and Profitability
How to Calculate Carbon Fiber Production Line Cost in 2026?
Production capacity starts with saleable output, not nameplate speed. A line rated at 300 kg per hour may run 8,000 hours annually. At 85% utilization and 92% yield, practical output reaches about 1,880 tonnes per year. Oak Ridge National Laboratory cost-model studies identify precursor, energy, labor, and conversion yield as major cost drivers. A small yield loss can quietly raise every kilogram’s cost.
Use this formula: cost per kilogram equals annual operating expenses plus depreciation, divided by saleable kilograms. For example, a 1,880-tonne line with annual costs of 14 million dollars produces a base cost near 7.45 dollars per kilogram. Include maintenance, testing, packaging, financing, and waste disposal. Otherwise, the spreadsheet looks healthier than the factory.
Profitability depends on selling price, utilization, and cash recovery. The U.S. Department of Energy’s carbon-fiber cost studies have used about 5 dollars per pound as a long-term cost target for lower-cost production pathways. That target is not a guaranteed 2026 result. Energy prices and precursor contracts may overturn it. A 10% decline in utilization can sharply reduce operating margin because depreciation remains fixed. It hurts. Sensitivity testing should compare 70%, 85%, and 95% utilization, while checking yield, labor shifts, and electricity prices. A realistic model should also reserve cash for commissioning delays and unstable early production.
Evaluating Financing, Maintenance, and Long-Term Investment Factors
How to Calculate Carbon Fiber Production Line Cost in 2026?
A reliable 2026 estimate must include financing, maintenance, and operating risks. Equipment price alone gives an incomplete picture. Compare the down payment, interest rate, loan term, and currency exposure before approving a purchase. A lower monthly payment may create a higher lifetime cost. Ask suppliers for detailed payment schedules, installation charges, training fees, and commissioning requirements.
Maintenance deserves a separate budget. Carbon fiber lines depend on controlled temperatures, tension systems, ovens, and precision winding equipment. Record expected service intervals for heaters, sensors, filters, bearings, and control components. Keep critical spare parts on site, especially when delivery may take several weeks. Planned maintenance can reduce unplanned downtime, but its labor cost is often underestimated. Production losses can exceed repair invoices.
Long-term investment analysis should connect line capacity with realistic sales demand. Calculate energy use per kilogram, staffing needs, waste rates, facility upgrades, and quality testing expenses. Then model conservative, expected, and optimistic production levels. A spreadsheet can still lie. Forecasts may ignore training delays or slower customer approval. Review assumptions with production engineers, finance staff, and independent maintenance specialists. Recheck the model annually because energy prices, financing conditions, and replacement costs can change. That estimate may be wrong. Allow a contingency reserve for problems that cannot be predicted precisely.
How to Calculate Carbon Fiber Production Line Cost in 2026? - Evaluating Financing, Maintenance, and Long-Term Investment Factors
Planning model for a new PAN-based carbon fiber production line. Figures are indicative 2026 budgeting ranges in USD and should be replaced with supplier quotations, site-specific engineering studies, and confirmed financing terms.
1. Estimated Capital Cost Breakdown
| Cost Component | Scope Included | Low Case
(USD million) | Base Case
(USD million) | High Case
(USD million) | Typical Cost Driver |
| Front-end engineering and permitting | Process design, layout, environmental studies, permits, and project management | 0.80 | 1.50 | 3.00 | Plant complexity, local regulations, and engineering depth |
| PAN precursor preparation | Precursor handling, feed preparation, storage, and related process equipment | 2.00 | 5.00 | 10.00 | Precursor specification, production volume, and automation level |
| Stabilization or oxidation ovens | Controlled heating zones, exhaust treatment, temperature controls, and safety systems | 3.00 | 7.00 | 15.00 | Number of tow lines, residence time, temperature uniformity, and emissions controls |
| Carbonization furnaces | Low-temperature and high-temperature furnace sections, atmosphere control, and cooling | 5.00 | 12.00 | 25.00 | Maximum operating temperature, furnace length, throughput, and energy efficiency |
| Surface treatment and sizing | Electrochemical treatment, washing, drying, sizing application, and recovery systems | 1.50 | 4.00 | 8.00 | Fiber grade, chemistry requirements, and wastewater controls |
| Winding, slitting, and packaging | Take-up systems, tension control, bobbin handling, inspection, and packaging | 0.50 | 1.50 | 3.00 | Automation, tow count, quality inspection, and packaging format |
| Utilities and off-site infrastructure | Electrical distribution, gas systems, cooling water, ventilation, fire protection, and wastewater | 2.00 | 5.00 | 12.00 | Available site infrastructure, energy tariffs, and environmental requirements |
| Installation and commissioning | Mechanical and electrical installation, process integration, testing, and start-up support | 2.00 | 5.00 | 12.00 | Local labor rates, imported equipment, construction schedule, and site conditions |
| Initial spares and operator training | Critical spare parts, maintenance tools, operating procedures, and technical training | 0.50 | 1.20 | 3.00 | Equipment standardization, spare-part strategy, and workforce experience |
| Contingency allowance | Budget reserve for design changes, price escalation, delays, and unforeseen site work | 1.73 | 4.12 | 9.10 | Calculated at approximately 10% of the pre-contingency capital budget |
| Estimated installed capital cost | 19.03 | 45.32 | 100.10 | Excludes land acquisition, taxes, financing fees, and working capital |
2. Production Scale and Annual Operating Cost Assumptions
| Planning Scenario | Indicative Nameplate Capacity | Expected Utilization After Ramp-Up | Annual Saleable Output
(metric tons) | Annual Maintenance
(USD million) | Annual Fixed Operating Cost
(USD million) | Typical Application |
| Small commercial line | 1,000 metric tons per year | 75% | 750 | 0.57 | 2.50 | Specialty grades, pilot-to-commercial expansion, and regional supply |
| Medium commercial line | 3,000 metric tons per year | 80% | 2,400 | 1.36 | 5.50 | Balanced scale for industrial and transportation customers |
| Large integrated line | 10,000 metric tons per year | 85% | 8,500 | 3.00 | 12.00 | High-volume production with extensive utility and logistics infrastructure |
3. Financing and Long-Term Investment Comparison
| Planning Scenario | Installed Capital
(USD million) | Equity Contribution | Debt Portion | Illustrative Interest Rate | Loan Term | Estimated Annual Debt Service
(USD million) | Maintenance Over 10 Years
(USD million) |
| Small commercial line | 19.03 | 40%
7.61 | 60%
11.42 | 8.0% | 10 years | 1.70 | 5.70 |
| Medium commercial line | 45.32 | 35%
15.86 | 65%
29.46 | 8.0% | 10 years | 4.39 | 13.60 |
| Large integrated line | 100.10 | 30%
30.03 | 70%
70.07 | 7.5% | 12 years | 9.31 | 30.00 |
4. Key Cost Metrics for Investment Evaluation
| Metric | Calculation Method | Small Commercial Line | Medium Commercial Line | Large Integrated Line | Investment Interpretation |
| Capital cost per annual metric ton of nameplate capacity | Installed capital cost ÷ nameplate capacity | $19,030 per annual metric ton | $15,107 per annual metric ton | $10,010 per annual metric ton | Larger lines generally reduce capital intensity through scale |
| Maintenance cost per saleable metric ton | Annual maintenance ÷ annual saleable output | $760 per metric ton | $567 per metric ton | $353 per metric ton | Higher utilization and scale can lower maintenance cost per unit |
| Annual debt service per saleable metric ton | Annual debt service ÷ annual saleable output | $2,267 per metric ton | $1,829 per metric ton | $1,095 per metric ton | Financing burden is highly sensitive to utilization and output quality |
| Recommended working capital reserve | Three to six months of operating expenses and inventory needs | $0.90–$1.80 million | $1.90–$3.80 million | $4.50–$9.00 million | Protects cash flow during commissioning, yield losses, and customer qualification |
| Indicative economic life of major equipment | Expected service life with scheduled refurbishment | 15–20 years | 15–20 years | 15–20 years | Furnace linings, heating elements, controls, and exhaust equipment may require earlier replacement |
| Ramp-up period to stable commercial production | Time from mechanical completion to consistent yield and qualified product | 12–24 months | 12–24 months | 18–30 months | Revenue timing and early cash losses should be included in the financial model |
Model assumptions: Currency is USD; costs are presented in 2026 planning terms; the line is assumed to use PAN precursor and continuous processing; installed capital excludes land, taxes, import duties, financing fees, and working capital; output assumes 75%–85% utilization after ramp-up; actual costs vary with fiber grade, tow size, energy prices, environmental controls, local construction rates, automation, and project location.
