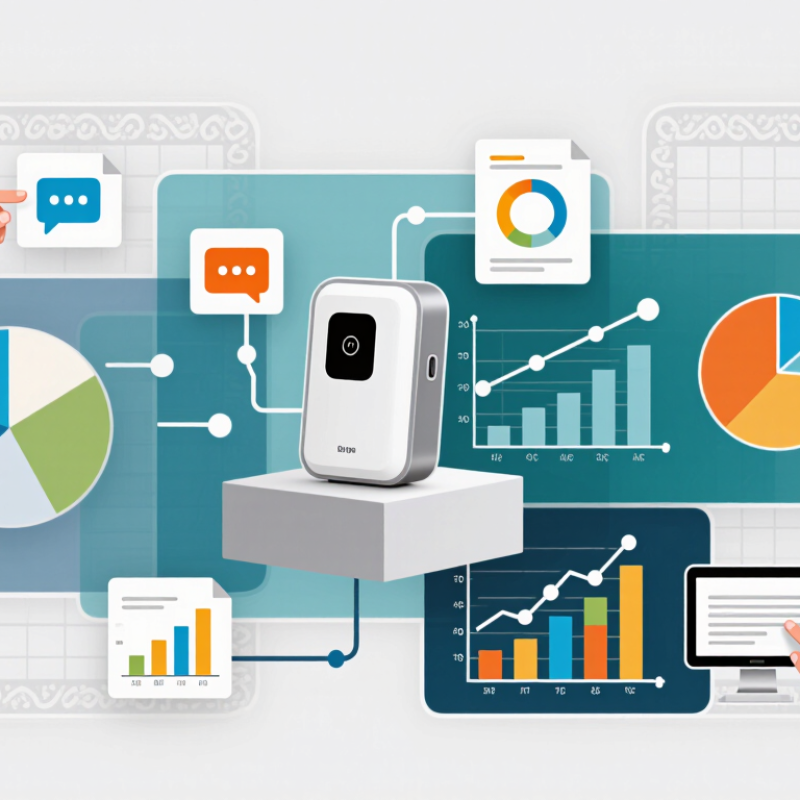
| 1 | Product hero illustration | Product pages, landing pages, and digital campaigns | Clear focal point, product context, restrained background, room for a headline | SVG for vector artwork; PNG or WebP for raster artwork | “Illustration of a reusable water bottle beside a glass of water.” | Shows what is being offered and helps place it in a recognizable use context. |
| 2 | Process infographic | Explaining workflows, onboarding steps, or service processes | Numbered steps, consistent icons, concise labels, clear reading order | SVG or accessible HTML; PNG or WebP when an image is required | “Four-step diagram showing request, review, approval, and delivery.” | Makes a sequence easier to scan and can clarify what customers should expect. |
| 3 | Data visualization | Reports, presentations, dashboards, and research summaries | Accurate scales, labeled axes, readable legends, source notes, accessible colors | Editable chart or HTML; SVG, PNG, or WebP for export | “Bar chart comparing quarterly support requests across four categories.” | Turns numerical information into a visual comparison; the underlying data should remain available. |
| 4 | Service feature icons | Feature lists, navigation, and service overviews | Consistent stroke weight, simple shapes, clear labels, adequate contrast | SVG for scalable interface graphics; PNG for fixed-size use | “Shield icon next to the label ‘Data protection.’” | Provides quick visual cues, while accompanying text supplies the full meaning. |
| 5 | Product interface mockup | Product demonstrations, proposals, and feature explanations | Legible interface details, realistic content, clear annotations, uncluttered framing | PNG or WebP for screen mockups; SVG for simple diagrams | “Mobile app screen displaying a monthly expense summary and category list.” | Helps audiences understand how a digital product or interface is organized. |
| 6 | Editorial concept illustration | Articles, newsletters, and thought-leadership content | One central idea, relevant symbolism, consistent visual tone, space for cropping | SVG for flat vector art; WebP or PNG for raster illustrations | “Illustration of a team connecting pieces of a project timeline.” | Adds a visual entry point to an idea without replacing the article’s actual information. |
| 7 | Comparison graphic | Service options, product specifications, and decision guides | Parallel columns, matched criteria, neutral labels, clear distinctions | HTML table for accessible data; SVG or PNG for a designed summary | “Comparison table showing storage limits and support hours for three service levels.” | Makes differences easier to assess when the criteria are stated consistently. |
| 8 | Campaign social graphic | Social posts, event announcements, and promotional updates | Short message, strong hierarchy, platform-appropriate crop, readable contrast | PNG or WebP; keep editable source files for revisions | “Event announcement graphic with date, topic, and registration details.” | Communicates a timely message in a compact format; essential details should also appear as text. |
| 9 | Customer journey map | Planning customer experiences, service design, and internal workshops | Stages, customer actions, touchpoints, pain points, and clearly identified assumptions | Editable diagram; PDF or SVG for sharing and print | “Journey map showing discovery, purchase, setup, and support touchpoints.” | Helps teams discuss interactions across stages; findings should be based on research where possible. |
| 10 | Presentation cover and section graphic | Business presentations, proposals, and training materials | Consistent layout, clear title area, simple visual motif, presentation-safe contrast | SVG or PNG; retain editable slides for updates | “Presentation cover graphic featuring an abstract network of connected points.” | Creates a visual framework for a presentation and supports consistent section navigation. |